Problem Statement
Maji Ndogo is a fictional region used as a simulated dataset by ExploreAI Academy, modelled on real agricultural challenges across Sub-Saharan Africa. The dataset draws place names from across the continent, including areas in Nigeria, Kenya, and South Africa, to represent diverse farming landscapes and climate conditions.
Smallholder farmers across Sub-Saharan Africa face increasing climate uncertainty. Erratic rainfall, rising temperatures, and shifting seasons make traditional farming knowledge less reliable. This project analysed crop yield data against climate variables within the Maji Ndogo dataset to identify patterns that could help farmers and agricultural planners make better decisions about what to grow, when to plant, and where to invest.
Approach
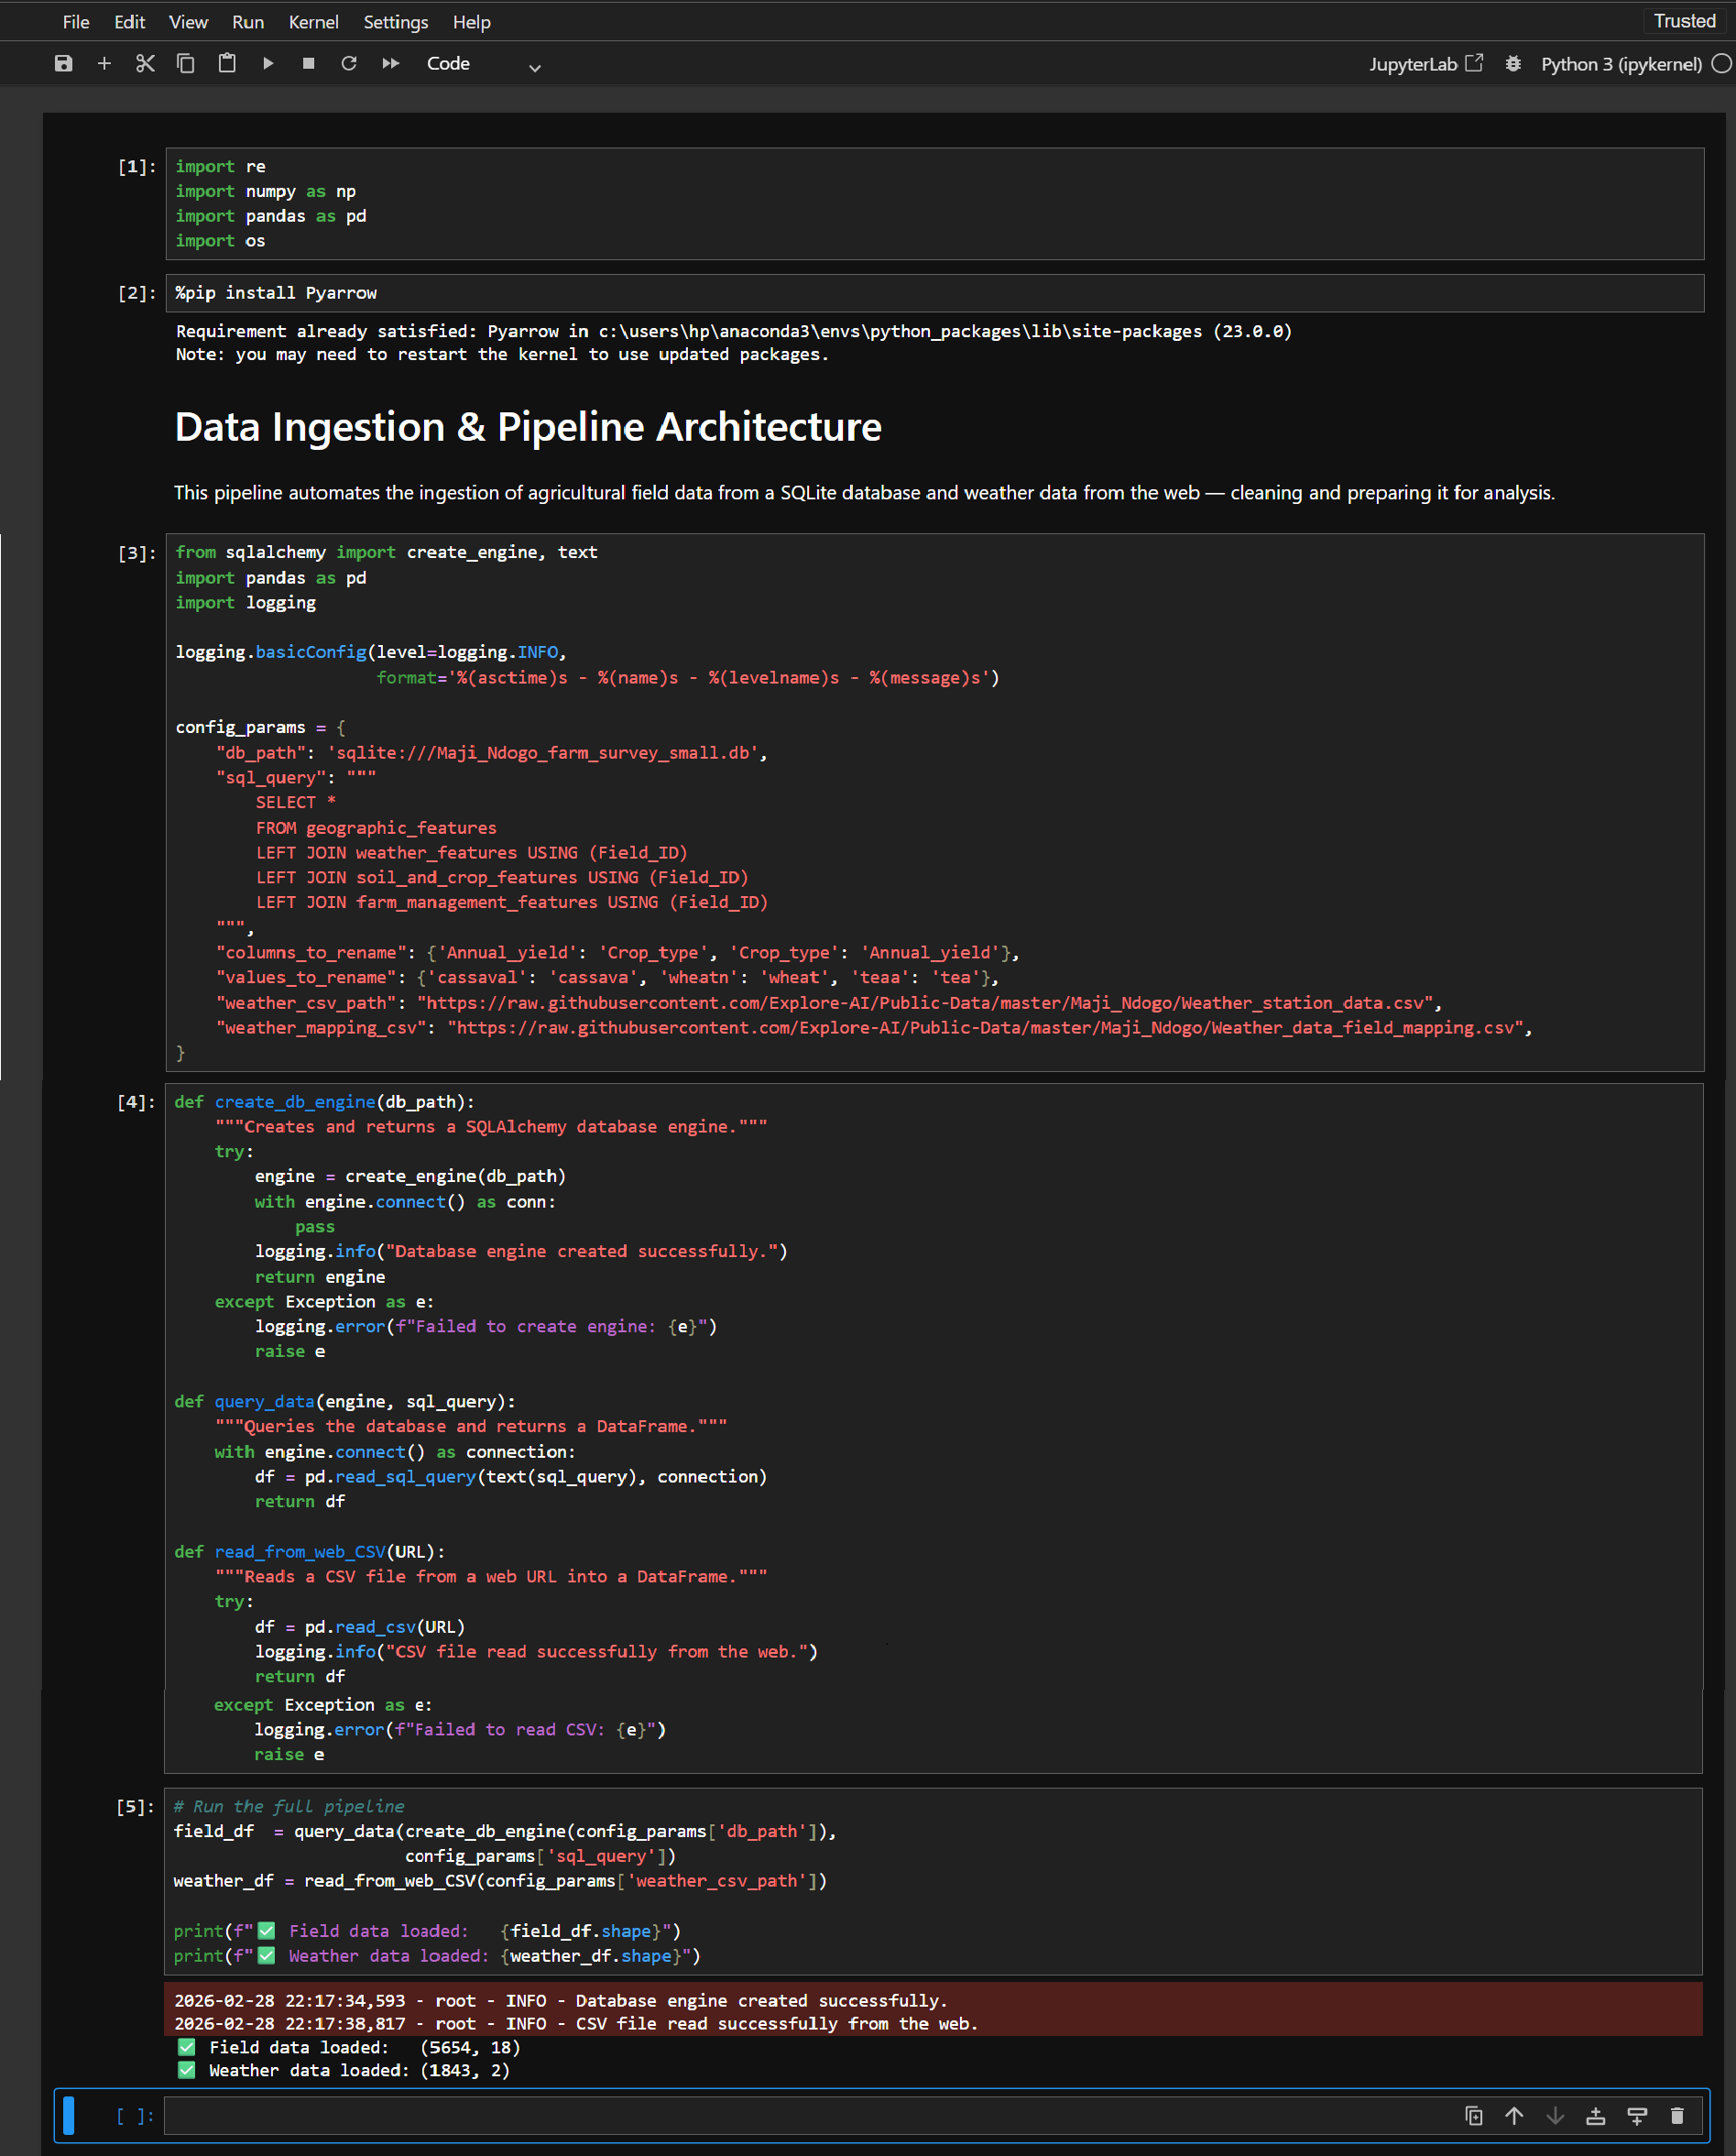
Starting from raw agricultural data in a SQLite database, I built a structured Python pipeline that takes data from ingestion through to final insights — designed to be reproducible and transparent at every stage.
- Loaded and validated raw agricultural datasets using Pandas and SQLAlchemy
- Cleaned missing values, corrected data types, and fixed spelling errors
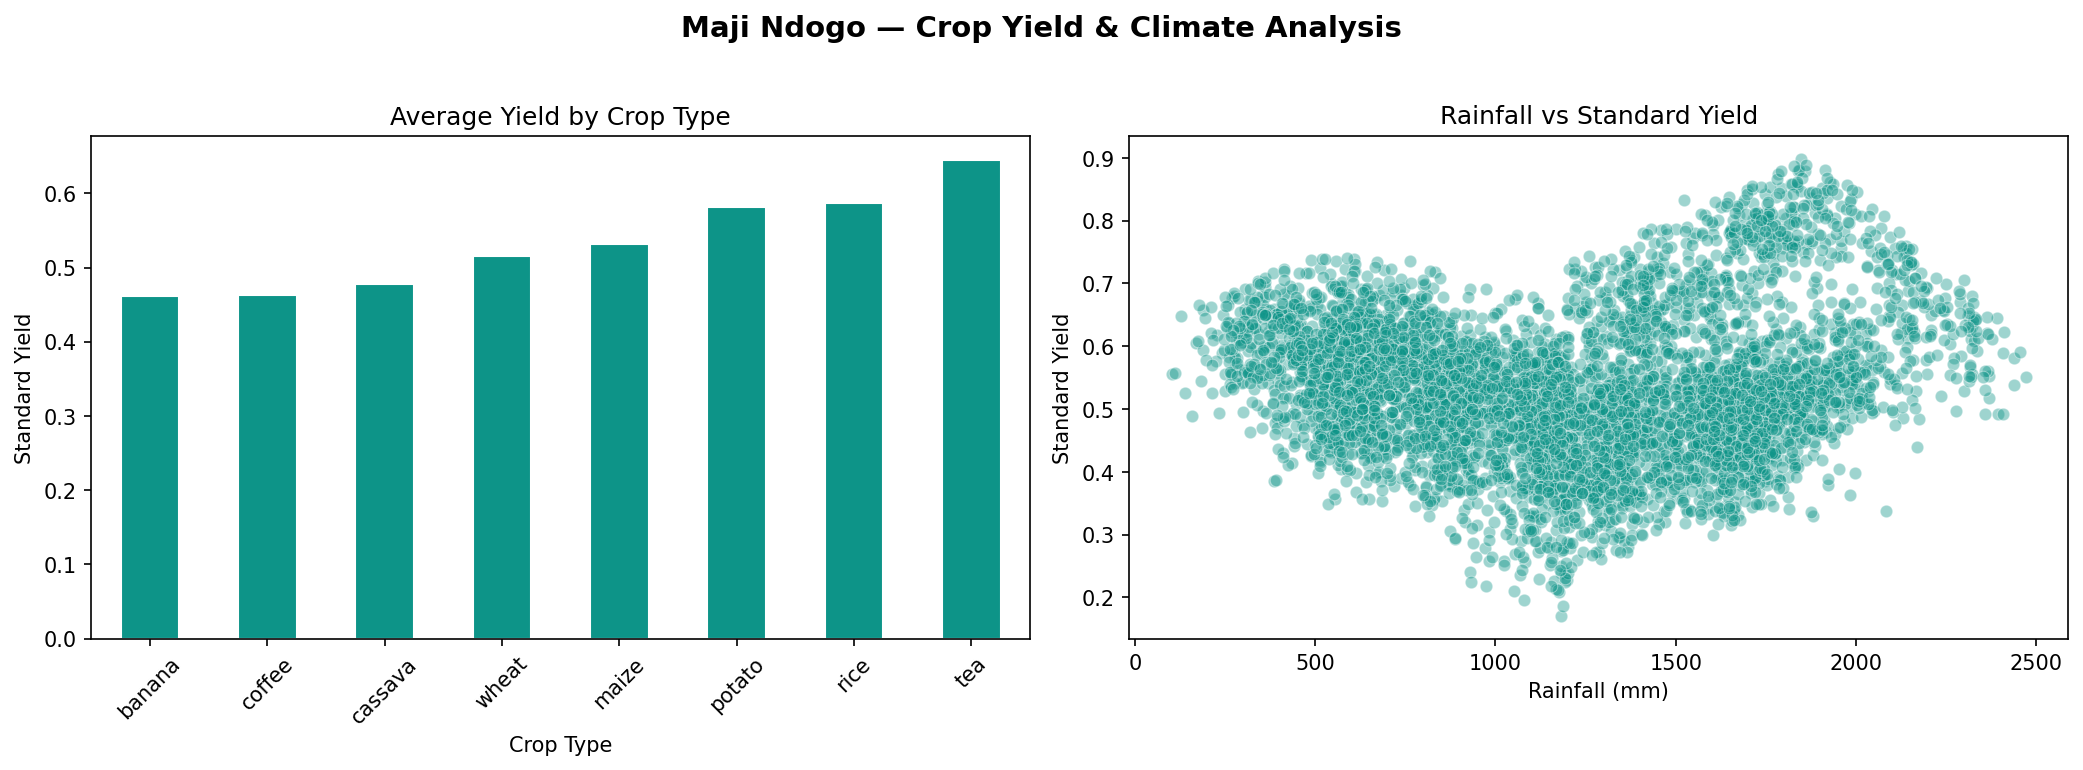
- Performed statistical analysis to identify correlations between climate variables and crop yields
- Built visualisations with Matplotlib to communicate findings clearly
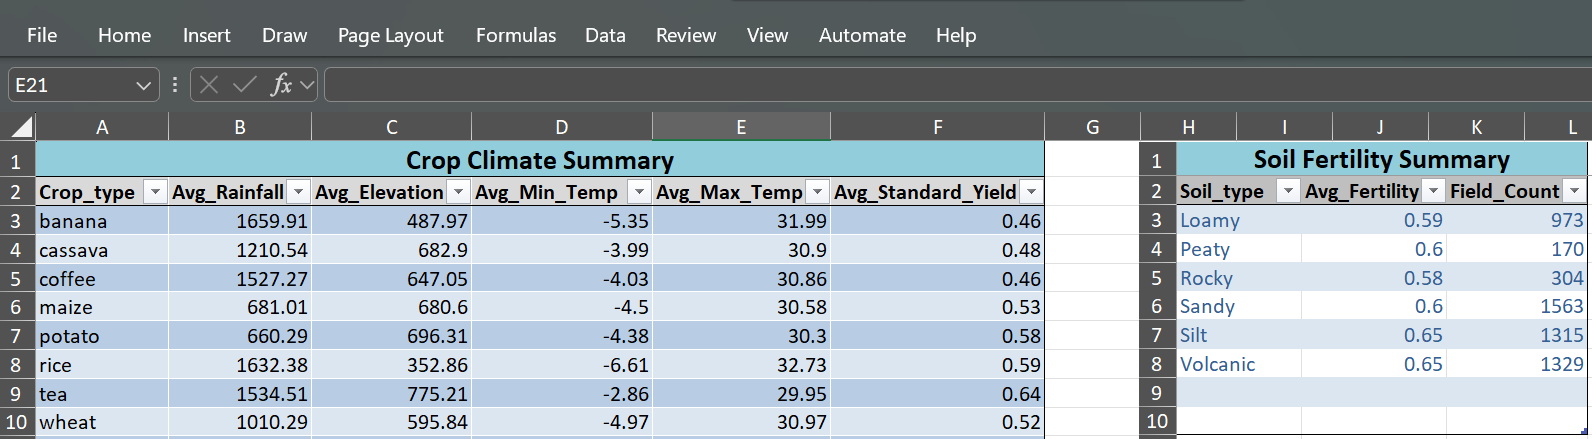
- Exported a summarised Excel report for non-technical stakeholders
Pipeline Architecture
Screenshots
Results
- Identified strong correlation between seasonal rainfall and crop yields across regions
- Flagged temperature anomaly years where yields dropped significantly
- Produced a clean Excel summary accessible to agricultural extension officers
- Built a reproducible pipeline that can be rerun as new data becomes available
Skills Demonstrated
- Python data pipeline design (Pandas, SQLAlchemy, Matplotlib)
- Data cleaning and validation at scale
- Statistical correlation analysis
- Data visualisation for storytelling
- Excel reporting for non-technical audiences
- Jupyter Notebook documentation