Problem Statement
Maji Ndogo is a fictional region used as a simulated dataset by ExploreAI Academy, modelled on real water access challenges across Sub-Saharan Africa. The dataset draws place names from across the continent, including areas in Nigeria, Kenya, and South Africa, to represent diverse rural and urban water infrastructure scenarios.
Millions of people across Sub-Saharan Africa lack access to safe drinking water. But beyond the infrastructure gap, there is another problem: funds allocated for water projects do not always reach their intended purpose. This project investigated financial irregularities within the Maji Ndogo dataset, looking for patterns that could indicate fraud, misallocation, or corruption in public water spending.
Approach
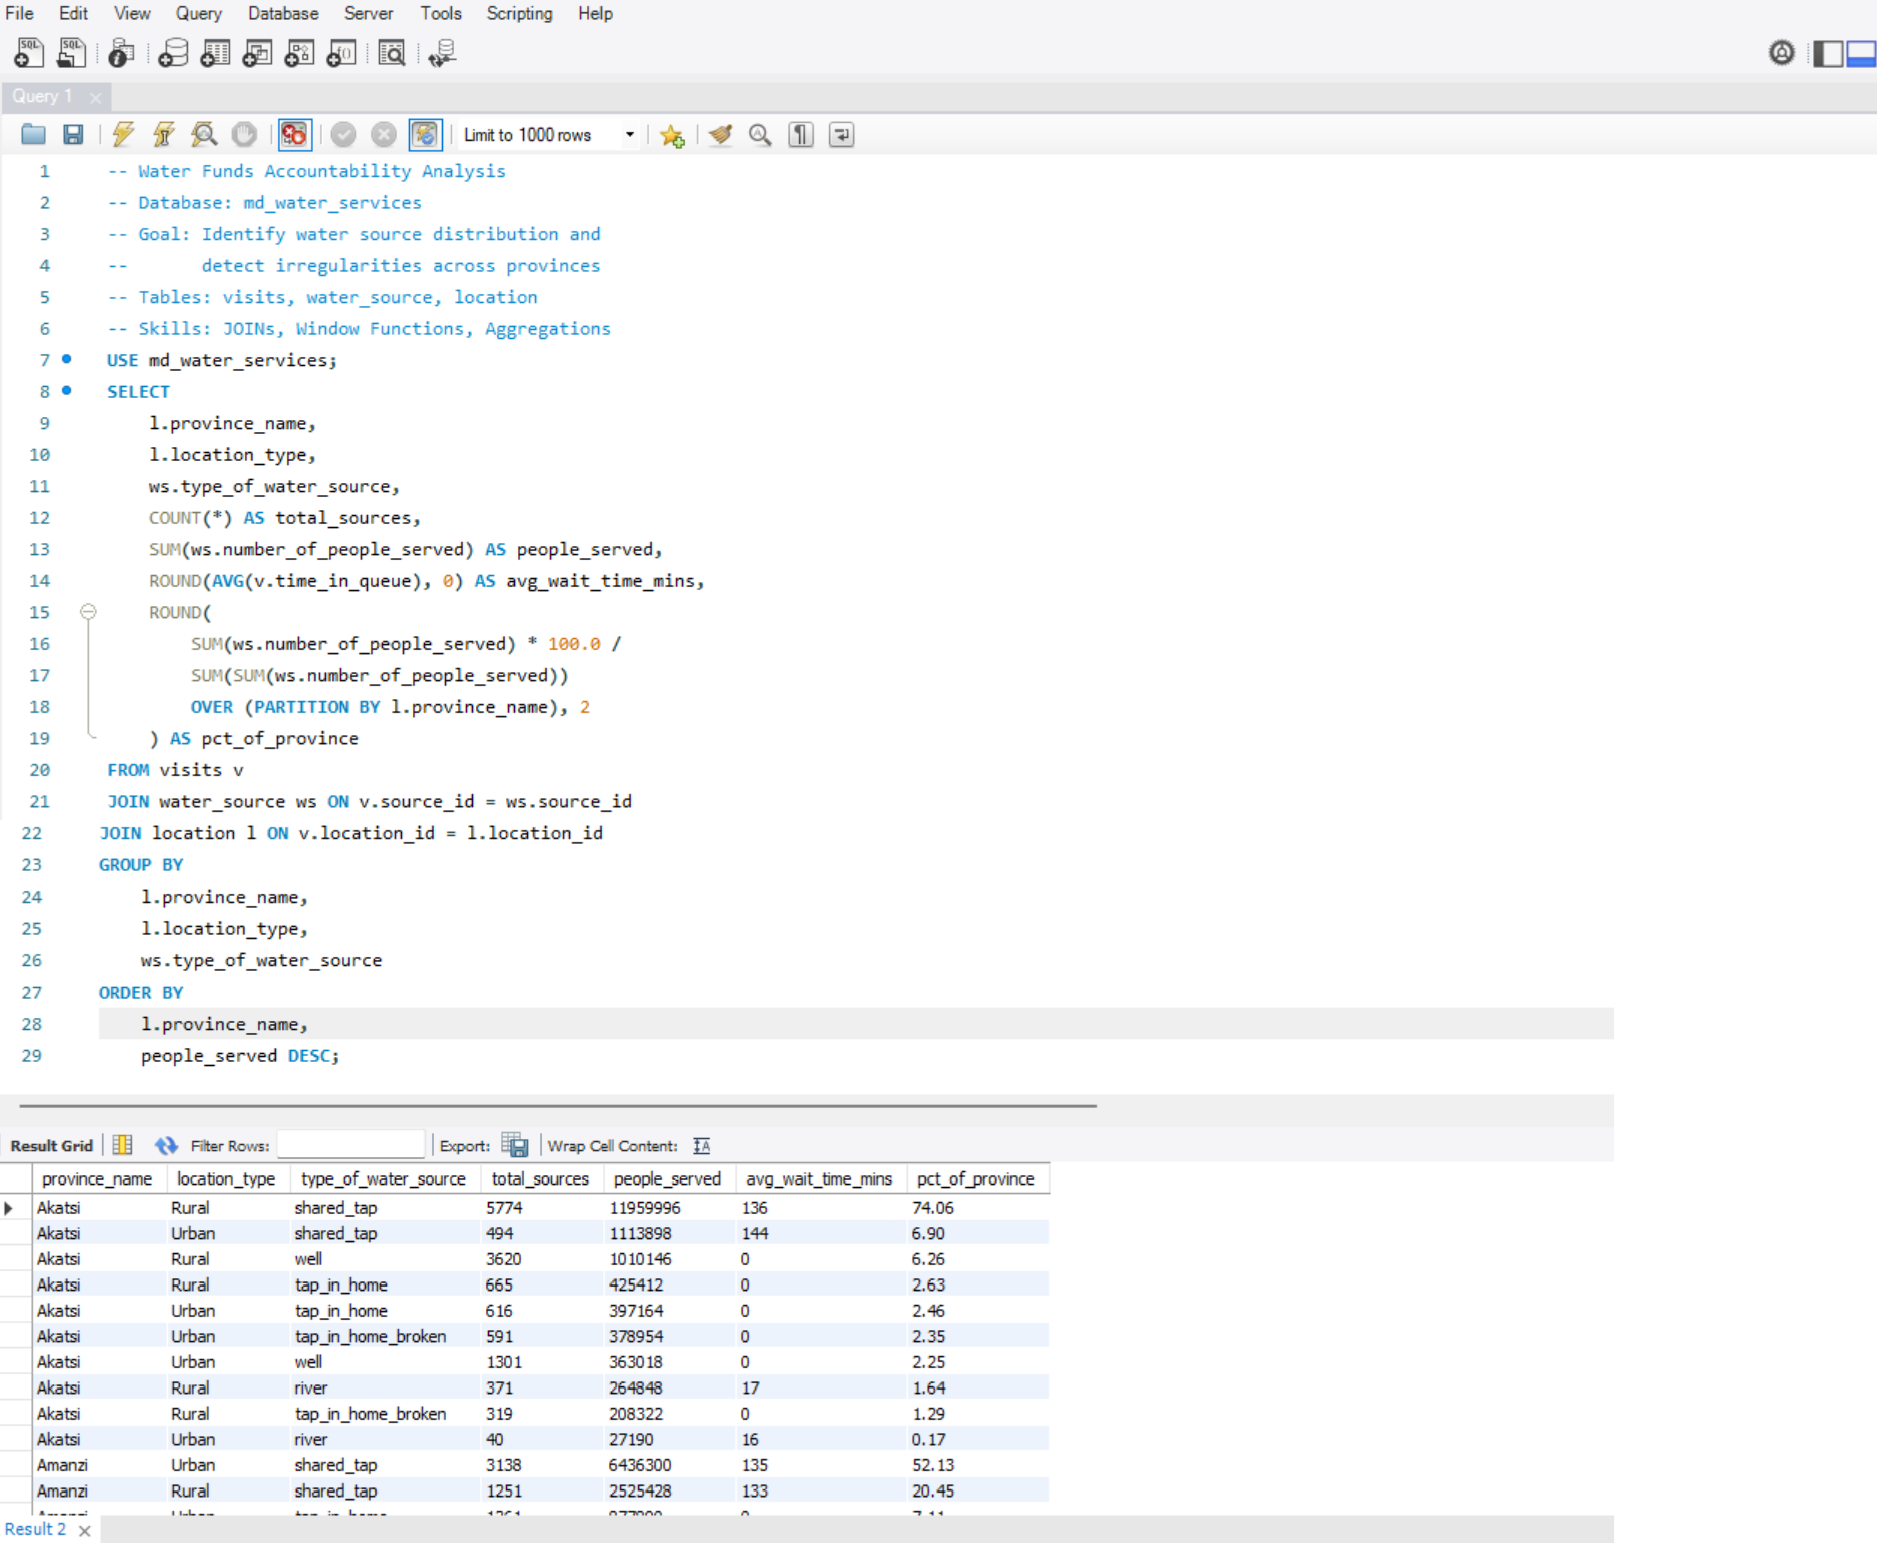
Working with the md_water_services database in MySQL Workbench, I designed SQL queries to cross-reference spending records, visit logs, and location data. Findings were summarised in an Excel pivot table and visualised in Power BI.
- Joined
water_source,location, andvisitstables to build a full picture per site - Used window functions to rank sources by visit frequency and flag outliers
- Identified employees with statistically unusual activity patterns
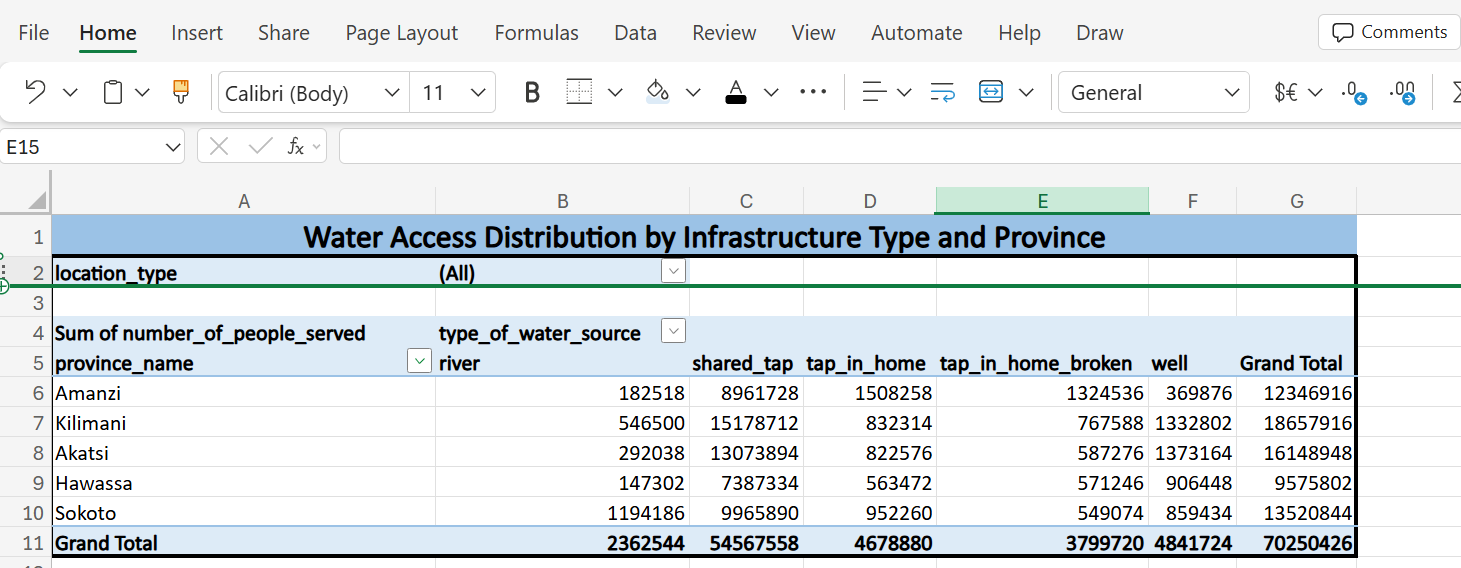
- Summarised findings in an Excel pivot table for stakeholder reporting
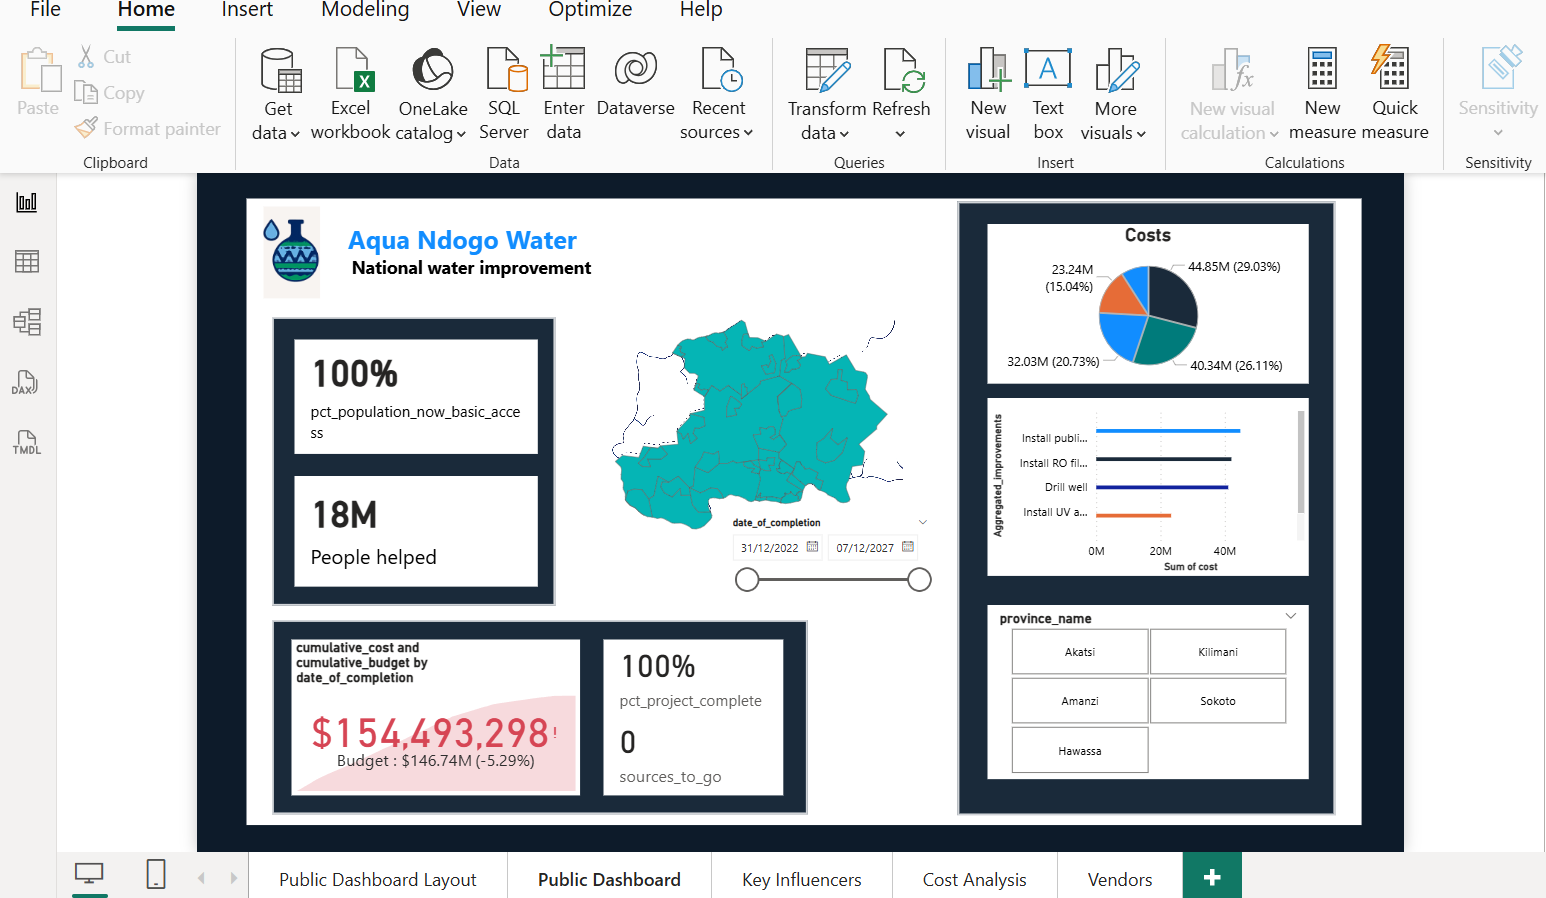
- Built a Power BI dashboard to communicate patterns visually
SQL Analysis
Screenshots
Results
- Identified sources with disproportionately high visit counts relative to population served
- Flagged employee records with irregular audit scores across multiple sites
- Summarised provincial water access patterns in an Excel pivot table
- Built a Power BI dashboard making findings accessible to non-technical stakeholders
- Demonstrated how SQL window functions can be used as a fraud detection tool in public sector data
Skills Demonstrated
- Multi-table SQL JOINs across relational database
- Window functions: SUM() OVER, PARTITION BY, ORDER BY
- Anomaly detection through statistical comparison
- Excel pivot tables for stakeholder reporting
- Power BI dashboard design and data storytelling